See how often your customers come back.
How often your customers come, where they are on their card, and when your shop is busiest. Every scan fills it in, with nothing to type.
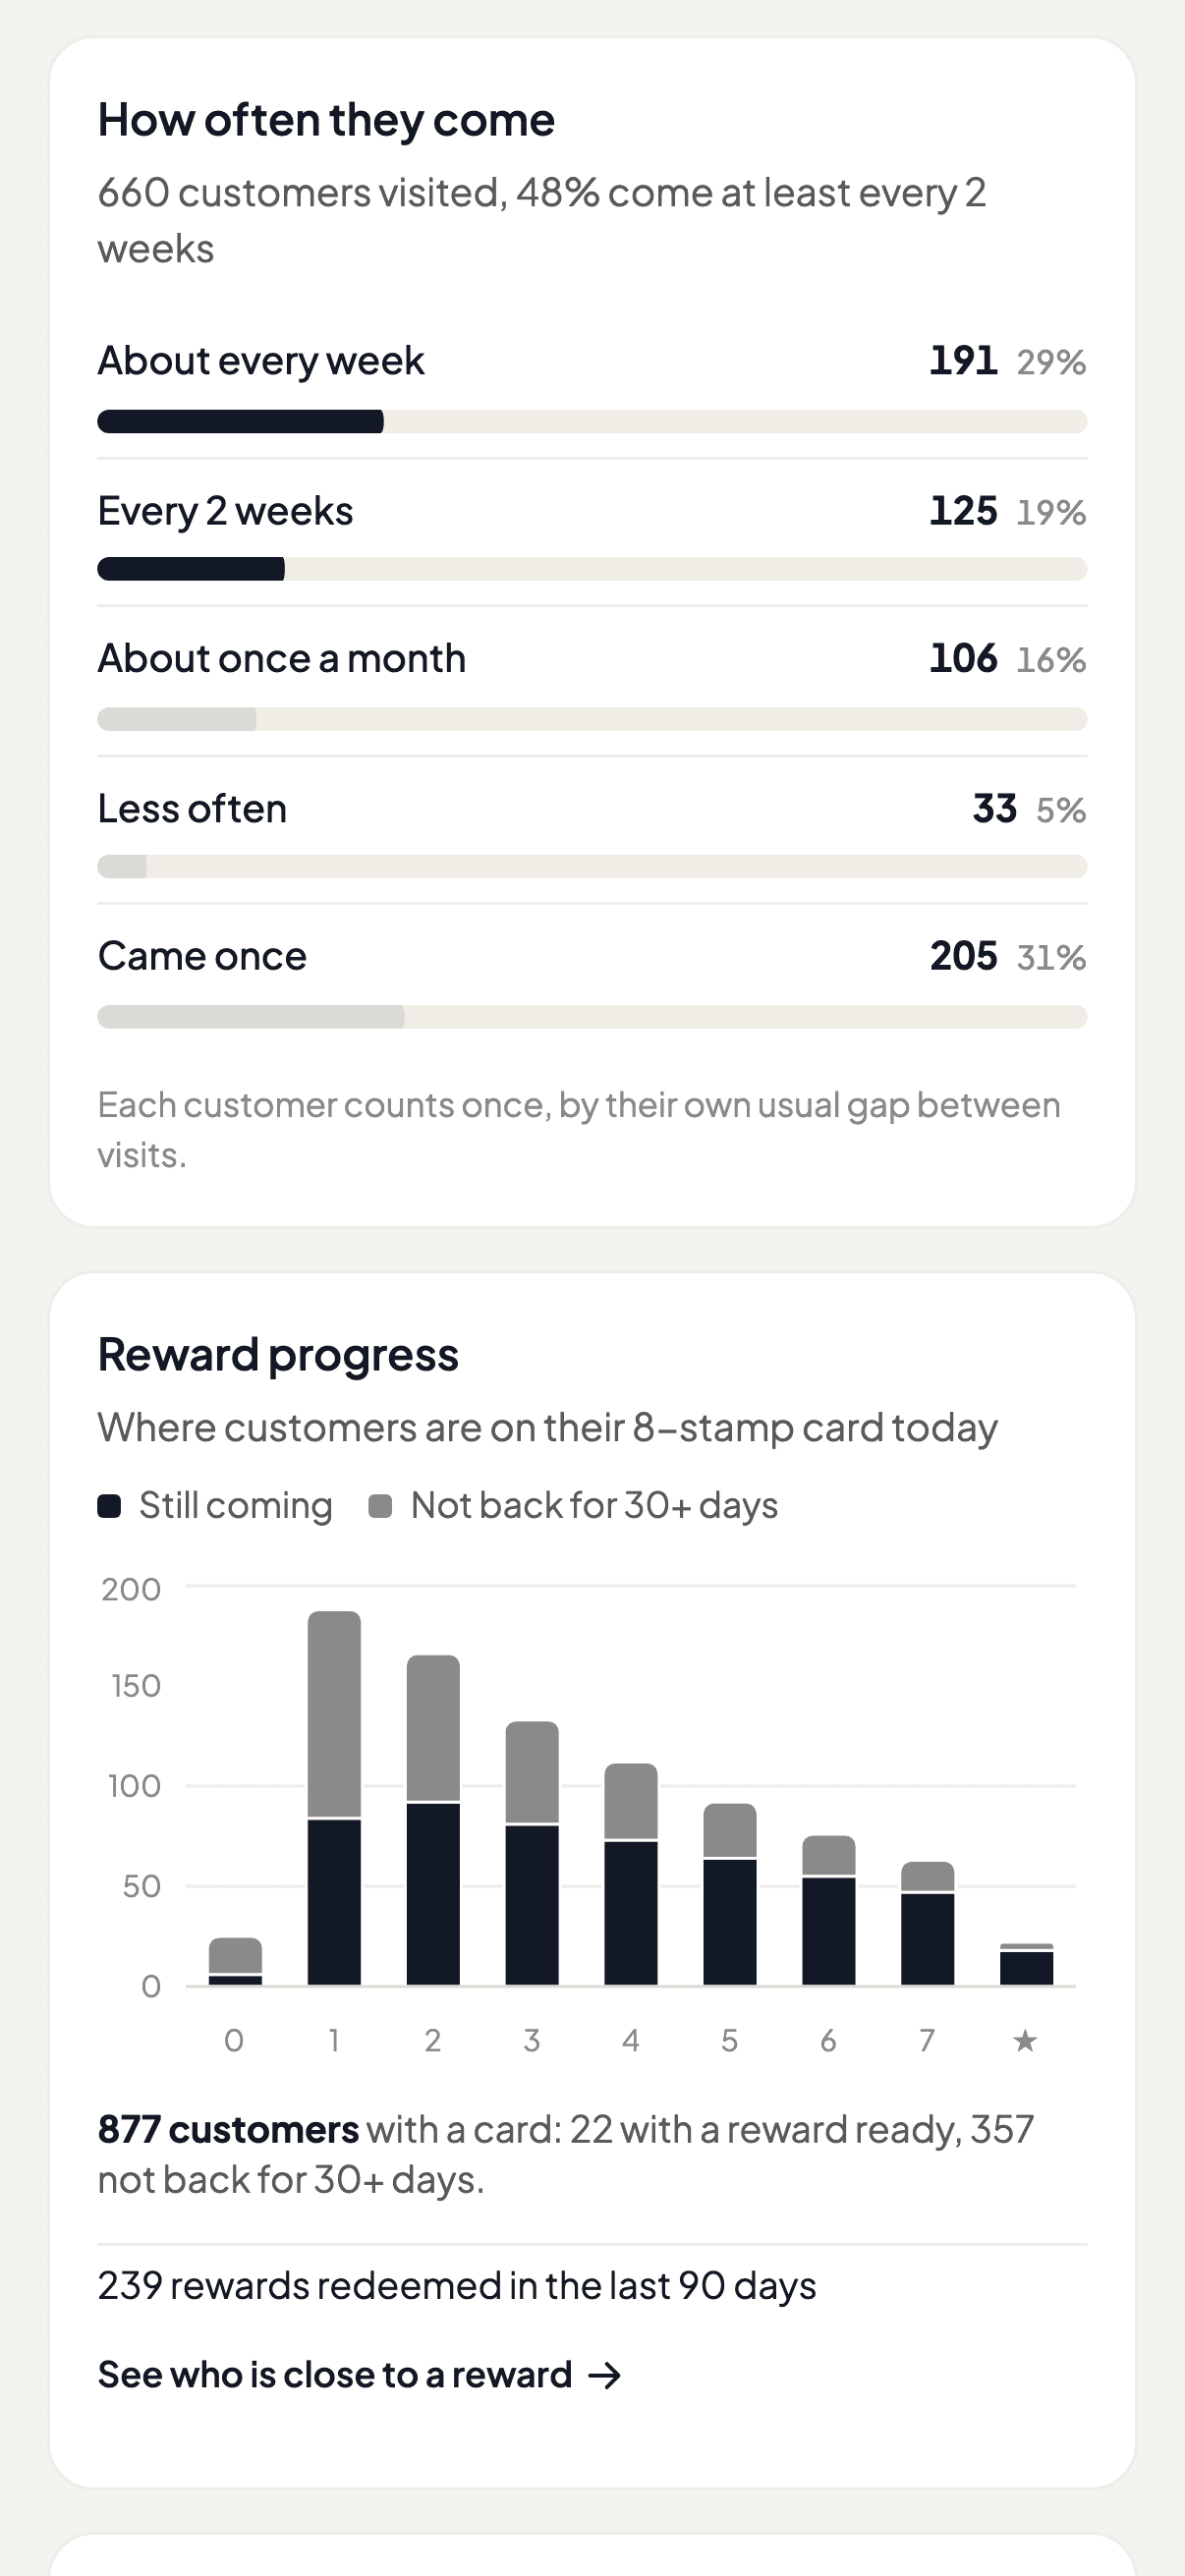

What you don't know today
With paper cards, you're managing loyalty blind. No data, no visibility, no way to improve what you can't measure.
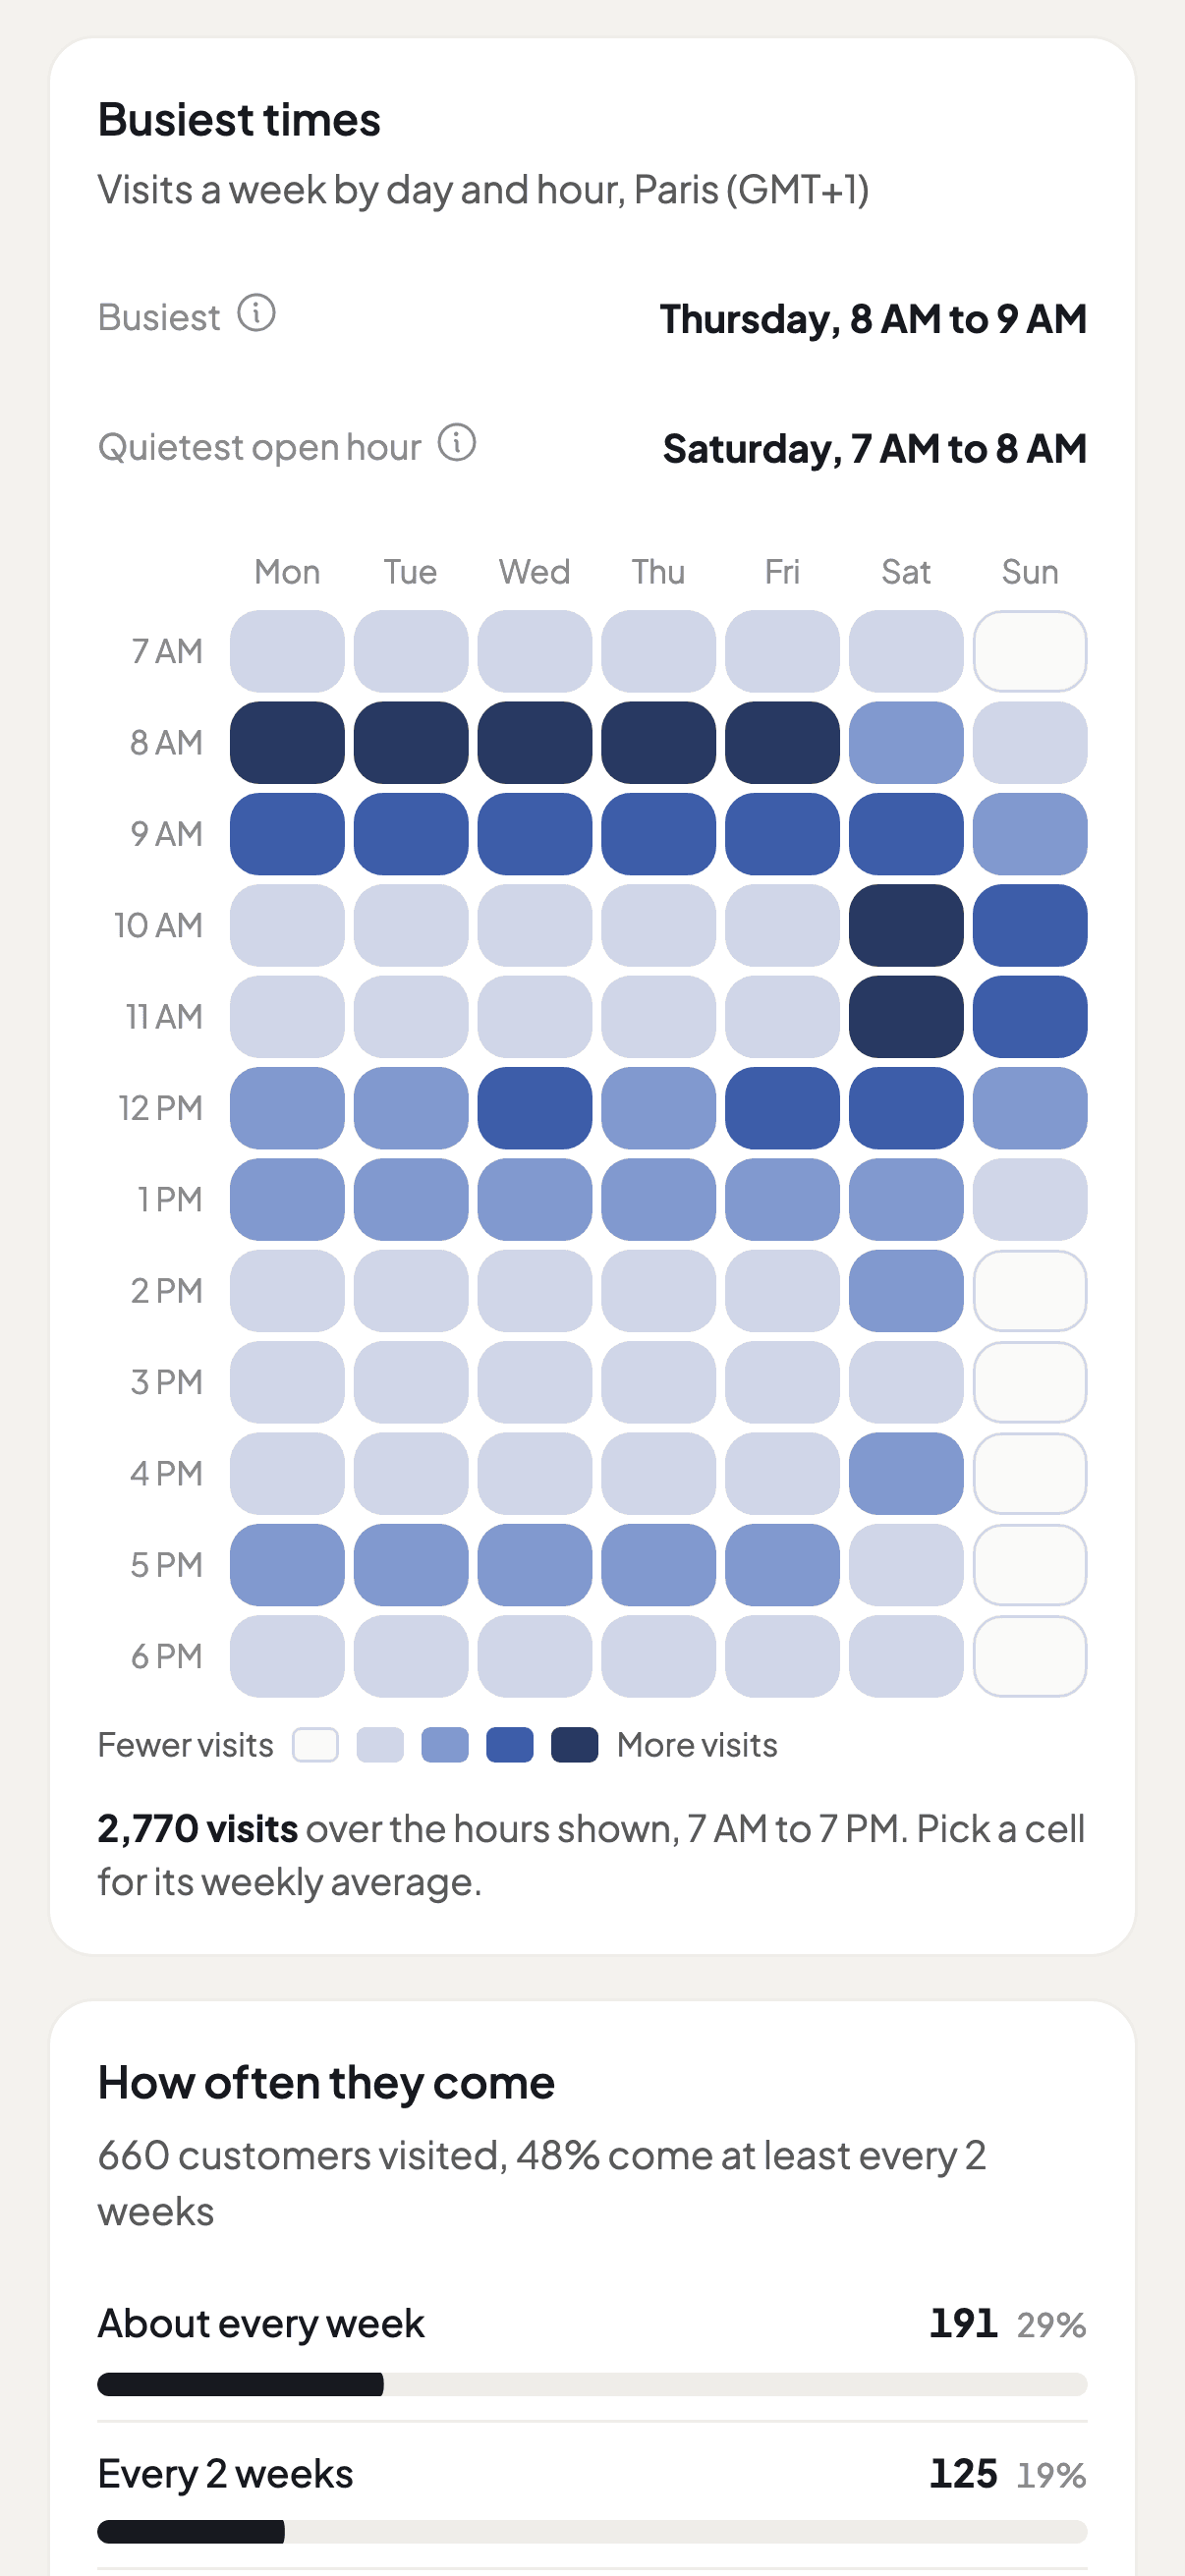
Your rush hours, at a glance
Visits by day and hour in your shop's time zone, with your busiest slot and your quietest open hour. Starter shows the busiest hour in a sentence; Growth and Pro show the grid.
Your business, in real time
Every stamp, every reward, every new card: follow your loyalty program as it happens.
Understand trends, not just numbers
A visits chart on every plan, with the highlights of busiest times, how often customers come and where they are on the card. Growth and Pro chart those too and look further back, and Pro adds monthly cohorts.
Scans / week
Peak hours
30d retention
72%
Scans / week
Customer segments
Completion rate
complete their card
At-risk customers
inactive 30d+
Peak hours
Most active days
30d retention
72%
Avg time to complete card
Post-reward return
start a 2nd card
Stop guessing. Start knowing.
Every plan charts your visits and shows the highlights of your busiest times and how often customers come back. Growth and Pro chart those too and look further back, and Pro adds monthly cohorts.
Start Free→